B2B firms are investing more of their budgets in content marketing but a common challenge remains in trying to track the return on investment (ROI). In fact less than one in three UK marketers said they were successful in this regard, according to a recent report from the Content Marketing Institute (CMI).
Regular analysis of website activity remains one of the best measures of content marketing ROI. Not only can it show you the effectiveness of your previous content, it can also give you a useful steer on your audience’s interests and preferences, which you can apply to planning future content, online and offline.
Where to begin
You should begin by asking the right business questions. This is much easier if you have a documented content marketing strategy as you will have already considered your business objectives and what you want from your content campaigns. Asking the right questions before you start is important because Google Analytics can collect data about the interactions with your website, but goals cannot be set to show retrospective performance.
Each piece of content on your website should be created with a specific purpose in mind – to move prospects along the business development pipeline. So by thinking through the typical user journey for each of your audience segments, you should have a clear idea of what actions should result after visiting those pages. From there you can decide which key performance indicators (KPIs) align with those objectives.
More about the fundamentals can be found in our previous blog post ‘Website analytics: measuring not counting’.
What to measure
When it comes to analytics, our mantra has always been measuring not counting. That means metrics such as total visits or page views are only as valuable as the questions you are able to answer from them.
With this in mind, here are some of the main metrics you might want to track and why, together with the common B2B calls-to-action (CTAs) that can be tracked.
1. Total visits
Ideally the total number of visitors should grow steadily and is a good indicator of whether your inbound marketing practices are working. If visits drop during a particular month, you’ll want to know why. Are you receiving fewer visitors from one of your social media channels, or has your last e-mail campaign underperformed?
2. Traffic sources
Traffic sources appear in the ‘Acquisition’ section of Google Analytics.
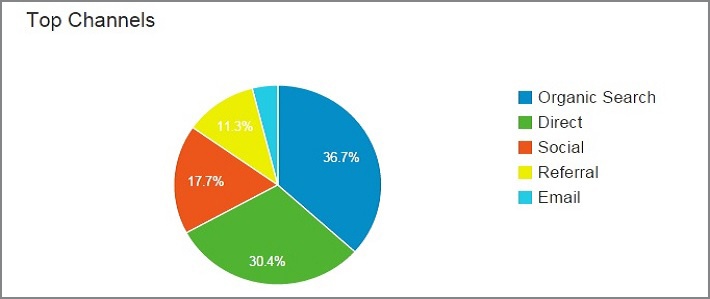
The four main sources to keep an eye on are:
- Direct – those who’ve typed your URL directly into a browser
- Organic – those who’ve found you by search
- Referral – those who’ve come to you via another referring site
- Social – those who’ve clicked through via a social media channel
Find out which sources are working best for you and direct your marketing campaigns accordingly. Or, if it is a source you know should be performing better, look at what could be going wrong.
3. Most-viewed pages
Found in the ’behaviour’ section of Google Analytics, ‘site content’ data shows you which pages have had the most views. This is an obvious place to discover what type of content or topic is pulling in the most interest, both short and long term, and also the types of headlines that get attention. You can also prioritise these pages to ensure they include the key elements you’d like visitors to see and act upon.
Be wary of red herrings though. Old or obscure pages can sometimes appear high in the rankings due to a legacy referral link or misleading headline, so dig deeper to see if their popularity is also backed by time spent on the page.
4. Bounce rate
The bounce rate measures the number of visitors that leave your website after only visiting the page they arrived on. A high bounce rate can indicate that visitors are not finding what they are expecting to so it’s worth investigating which pages are incurring higher bounce rates and checking which sources they are coming from.
For instance, it may be that organic keyword searches for specific terms are bringing in the wrong audience from search engines. If this is the case, you can review the terms being used across your website to make sure they suitably represent your services. If a keyword with a high bounce rate is one you are happy to be associated with, look at the quality of the content and calls-to-action (CTAs) on that page.
Remember though that if the page in question delivers exactly the right information quickly, such as a key phone number, a high bounce rate may not be a negative indicator.
Tracking calls-to-action (CTAs)
CTAs can be tracked using event goals. There are five types of goals that can be measured with Google Analytics (see image below). These goal types can be used to measure your CTAs and other key performance indicators (KPIs).
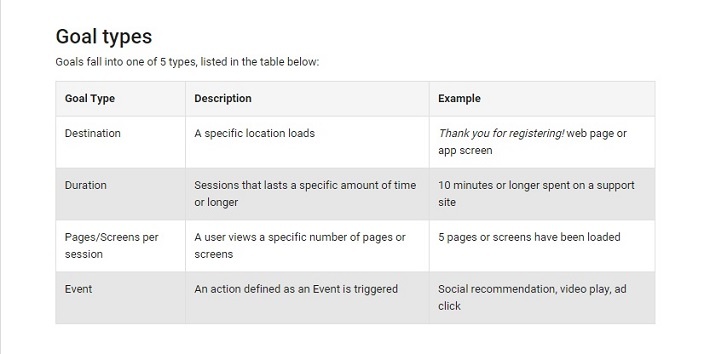
For more information on creating goals on Google Analytics visit the Google Analytics help page
5. Contact forms: Contact us / Quick enquiry / Call back request
Contact forms offer the viewer a direct way to get in touch with the company and represent a clear buying signal.
Potential questions relating to these goals could include:
- Does the number of enquiries increase during particular campaigns?
- Do enquiries happen more often from particular content pages?
- What types of enquiries are being made?
Setting up event goals for these contact forms and asking these questions will give you greater insight into how your marketing strategy is performing. To track how users navigated your website before reaching a goal you will need to look at the Goal Flow report.
6. Downloads: Videos / podcasts / pdfs
As another clear sign of engagement, it pays to keep track of which types of content get the most plays or downloads. Set up event goals that let you know when someone has watched a video, listened to a podcast or downloaded a pdf.
By comparing the popularity of your content, you can find evidence that shows where you should be concentrating your future efforts.
7. Registration forms
Data-capture should be a key goal for B2B firms, enabling more regular contact through outbound campaigns.
Tracking and comparing registration form downloads will give a good indication of how your audience values content such as research reports, whitepapers or webinars, and for which types they are most willing to provide contact details. Testing different forms will also help you decide if you are asking for too much information and which CTAs work better.
Final thoughts
By measuring carefully considered KPIs with relevant metrics and conversion goals on Google Analytics you can develop a clear view of what is working and what isn’t and then trial a different mix of content until you find your ideal content formula.
You will also have solid evidence of the success of your content marketing endeavours to take to the boardroom.
But beware of drawing conclusions from your data without fully considering all the angles. Data can be misleading if particular variables are missed.
Approach Google Analytics after a thoughtful process of documenting your business objectives, deciding what your KPIs should be and with expert help, figuring out exactly how to configure the corresponding conversion goals with your analytics software.
DOWNLOAD OUR FREE GUIDE: For more details on planning a content marketing strategy and measuring its ROI, download ‘Content marketing strategy for professional services firms’